Illumina Delivers $700K in Estimated Annual Manufacturing Impact and Accelerates Investigations by 96% with TigerGraph

The Challenge
Illumina needed to identify the factors impacting chemical yields across complex FFN and Primer production processes. Disconnected data and extensive manual SQL joins made investigations time- consuming, error-prone, and dependent on tribal knowledge.
The Solution
Implemented TigerGraph to automatically map and analyze 500,000+ manufacturing relationships, score key parameters affecting yield, eliminate 50+ SQL joins, and enable interactive investigations through TigerGraph Insights.
The Results
Delivered an estimated $700K in annual manufacturing impact while reducing data-driven investigation time from 24 hours to one hour—a 95.83% improvement—and eliminating reliance on tribal knowledge.
The Challenge
Illumina faced the highly complex task of analyzing chemical yields across FFN and Primer production and determining which specific factors statistically influenced manufacturing outcomes. Critical parameters—including bed height, mobile-phase pH levels, dead volume, and flow rate—needed to be evaluated together rather than as disconnected variables.
Traditional analysis lacked the integration required to understand these relationships. Analysts had to manually compile and align data from multiple sources, contend with gaps in data relationships, and perform extensive manual SQL joins before they could investigate the factors affecting yield.
The complexity of the underlying relationships made traditional database analysis impractical. More than 50 SQL joins would have been required to perform the analysis, while manual data manipulation and reliance on tribal knowledge made investigations slower, more error-prone, and difficult to standardize.
Traditional analysis lacked the integration required to understand these relationships. Analysts had to manually compile and align data from multiple sources, contend with gaps in data relationships, and perform extensive manual SQL joins before they could investigate the factors affecting yield.
The complexity of the underlying relationships made traditional database analysis impractical. More than 50 SQL joins would have been required to perform the analysis, while manual data manipulation and reliance on tribal knowledge made investigations slower, more error-prone, and difficult to standardize.
The Solution
Illumina implemented TigerGraph to automatically map the complex relationships within FFN and Primer manufacturing data, enabling analysts to investigate how interconnected production parameters affected chemical yields without manually assembling relationships across disconnected data sources.
TigerGraph enabled Illumina to analyze and rank the centralities of more than 500,000 relationships across the FFN and Primer manufacturing processes. The solution scored key parameters affecting yield and eliminated the need for more than 50 SQL joins that would have been impractical using traditional databases.
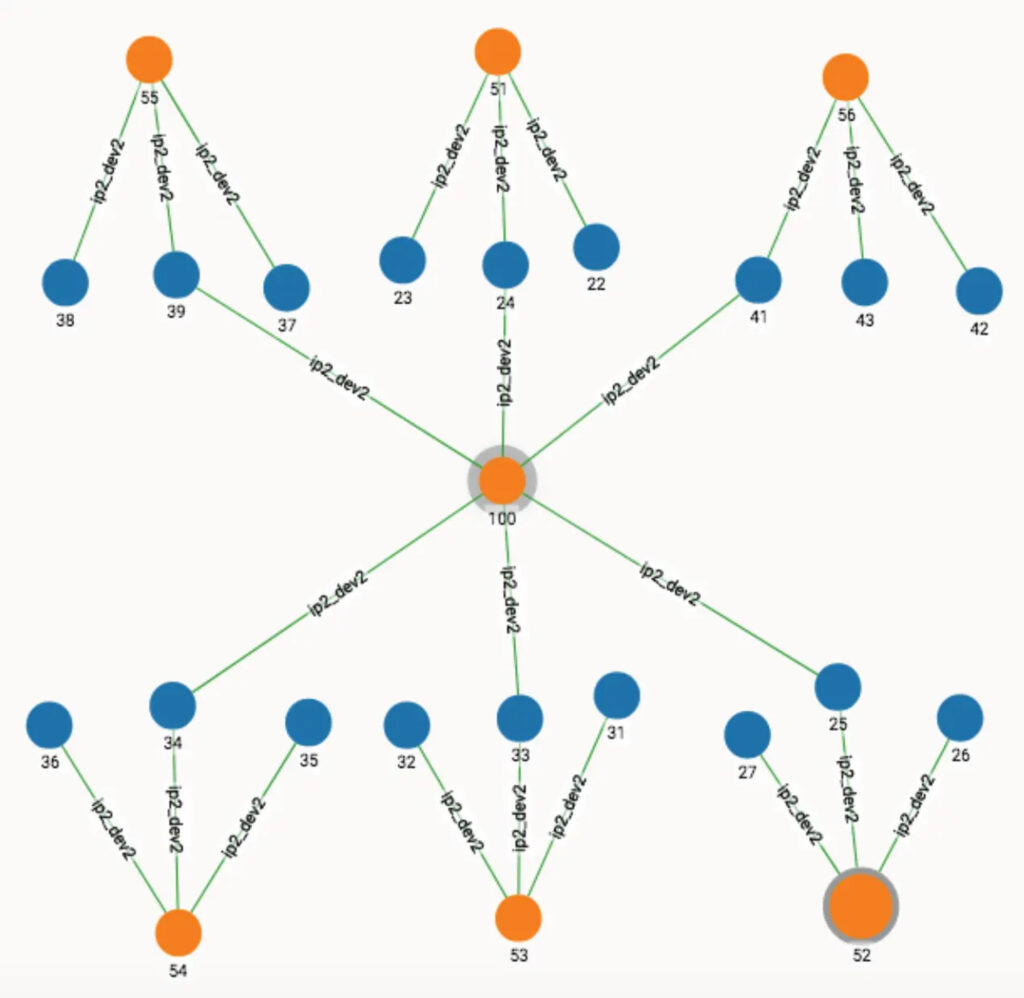
The solution also integrated with an interactive user interface through TigerGraph Insights, giving investigators a more efficient and intuitive way to explore relationships and investigate the factors influencing yield. This automated relationship mapping reduced manual data manipulation and standardized an analysis process that had previously depended on tribal knowledge.
TigerGraph enabled Illumina to analyze and rank the centralities of more than 500,000 relationships across the FFN and Primer manufacturing processes. The solution scored key parameters affecting yield and eliminated the need for more than 50 SQL joins that would have been impractical using traditional databases.
The solution also integrated with an interactive user interface through TigerGraph Insights, giving investigators a more efficient and intuitive way to explore relationships and investigate the factors influencing yield. This automated relationship mapping reduced manual data manipulation and standardized an analysis process that had previously depended on tribal knowledge.
The Results
The TigerGraph implementation delivered an estimated $700,000 annual impact within Illumina’s manufacturing operations. By automatically mapping manufacturing relationships and identifying the parameters affecting chemical yields, the solution turned a complex, manually intensive investigation process into a faster, standardized analytical workflow.
Data-driven investigation time fell from 24 hours to just one hour, a 95.83% improvement. At the same time, TigerGraph eliminated the need for more than 50 SQL joins and enabled analysis of over 500,000 relationships within the FFN and Primer manufacturing processes.
The solution also minimized manual data manipulation and entirely removed reliance on tribal knowledge, standardizing the investigation process and improving accuracy across the board. Investigators gained a more efficient and intuitive way to analyze the interconnected factors influencing manufacturing yield.
Data-driven investigation time fell from 24 hours to just one hour, a 95.83% improvement. At the same time, TigerGraph eliminated the need for more than 50 SQL joins and enabled analysis of over 500,000 relationships within the FFN and Primer manufacturing processes.
The solution also minimized manual data manipulation and entirely removed reliance on tribal knowledge, standardizing the investigation process and improving accuracy across the board. Investigators gained a more efficient and intuitive way to analyze the interconnected factors influencing manufacturing yield.
More stories




Ready to Harness the Power of Connected Data?
Start your journey with TigerGraph today!