Tier 1 Bank Accelerates Real-TimeMule Account Detection with TigerGraph

The Challenge
A Tier 1 bank needed to trace multi-hop fund movement and detect coordinated mule networks in real time. Building these capabilities from scratch would require a significant, multi-quarter engineering investment with considerable uncertainty.
The Solution
Implemented TigerGraph’s Mule Account Detection Solution Kit with a pre-built graph schema, algorithms, ML features, investigative queries, and dashboards to accelerate graph-based fraud detection without building core capabilities from scratch.
The Results
Accelerated time-to-value, reduced engineering risk, and enabled real- time multi-hop investigation of fund movement, shared IPs and devices, and coordinated account clusters— capabilities that were not feasible with relational tools.
The Challenge
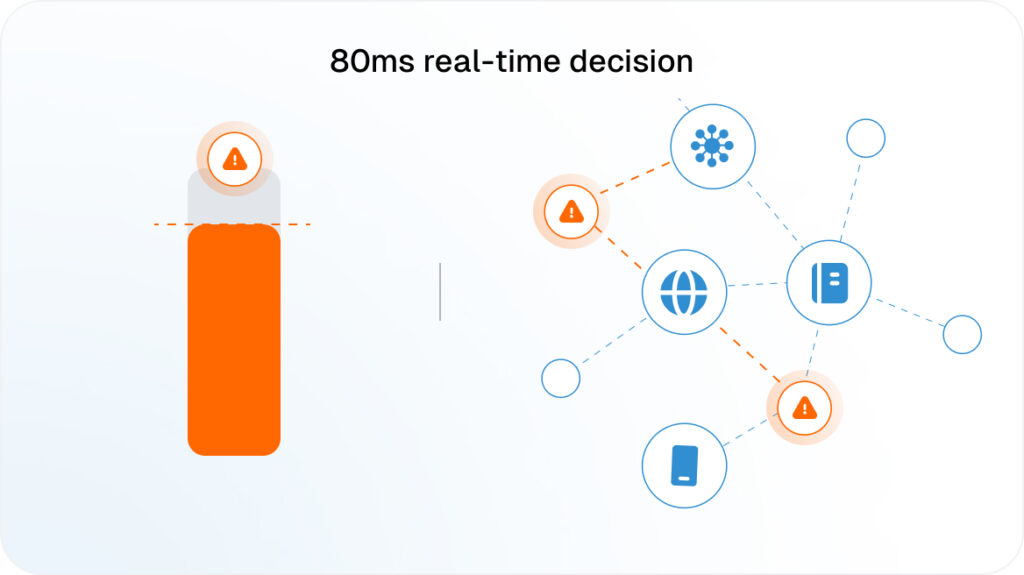
The bank’s existing fraud detection stack relied on relational and rules-based systems that struggled to trace multi-hop fund movement across large, interconnected account networks in real time. These approaches also made it difficult to detect coordinated behavior among clusters of accounts working together to move illicit funds.
The bank needed to uncover hidden relationships between accounts, devices, IP addresses, and merchants while scaling feature engineering for machine learning models fast enough to keep pace with changing fraud patterns. Building these capabilities natively would require a significant, multi-quarter engineering investment, including schema design, graph algorithms, and ML feature pipelines.
Beyond the engineering investment, there was considerable uncertainty around performance and effectiveness. The bank needed a faster, lower-risk path to graph-based mule detection without spending multiple quarters developing and validating the underlying capabilities from the ground up.
The bank needed to uncover hidden relationships between accounts, devices, IP addresses, and merchants while scaling feature engineering for machine learning models fast enough to keep pace with changing fraud patterns. Building these capabilities natively would require a significant, multi-quarter engineering investment, including schema design, graph algorithms, and ML feature pipelines.
Beyond the engineering investment, there was considerable uncertainty around performance and effectiveness. The bank needed a faster, lower-risk path to graph-based mule detection without spending multiple quarters developing and validating the underlying capabilities from the ground up.
The Solution
The bank adopted TigerGraph’s Mule Account Detection Solution Kit, providing a pre-built foundation for graph-based fraud detection. The solution included a purpose-built schema connecting customers, accounts, transactions, devices, IP addresses, merchants, and locations through relationships including ownership, transfers, shared devices, and shared IPs.
TigerGraph provided graph algorithms and derived machine learning features, including community detection to uncover coordinated account clusters, PageRank and centrality to identify distribution hubs, shortest-path analysis to trace laundering routes, IP and device sharing analysis, and multi-hop mule analysis. These features could feed directly into downstream ML models as pre-computed attributes.
A production-ready investigative query library supported the full investigative lifecycle, from initial detection through multi-hop transaction tracing, suspicious cluster identification, behavioral analysis, and counterparty risk. Two pre-built dashboards accelerated stakeholder adoption and validation by providing visibility into fraud outcomes, model performance, and key graph analyses.
TigerGraph provided graph algorithms and derived machine learning features, including community detection to uncover coordinated account clusters, PageRank and centrality to identify distribution hubs, shortest-path analysis to trace laundering routes, IP and device sharing analysis, and multi-hop mule analysis. These features could feed directly into downstream ML models as pre-computed attributes.
A production-ready investigative query library supported the full investigative lifecycle, from initial detection through multi-hop transaction tracing, suspicious cluster identification, behavioral analysis, and counterparty risk. Two pre-built dashboards accelerated stakeholder adoption and validation by providing visibility into fraud outcomes, model performance, and key graph analyses.
The Results
By adopting TigerGraph’s pre-built solution rather than developing graph-based mule detection from scratch, the bank accelerated time-to-value while reducing the engineering risk of a significant, multi-quarter development effort. Its team could focus resources on tuning and scaling the solution to its own data and risk posture.
The bank gained real-time, multi-hop investigative capabilities that were not feasible with its relational tools, including tracing fund movement, analyzing shared IP and device infrastructure, identifying coordinated account clusters, and generating graph-derived features for downstream machine learning models.
The structured quick start process allowed the bank to validate results at each implementation stage before progressing to production data, while pre-built dashboards helped fast-track stakeholder buy-in and validation through visibility into fraud outcomes, model performance, and graph analysis.
The bank gained real-time, multi-hop investigative capabilities that were not feasible with its relational tools, including tracing fund movement, analyzing shared IP and device infrastructure, identifying coordinated account clusters, and generating graph-derived features for downstream machine learning models.
The structured quick start process allowed the bank to validate results at each implementation stage before progressing to production data, while pre-built dashboards helped fast-track stakeholder buy-in and validation through visibility into fraud outcomes, model performance, and graph analysis.
More stories

Fintech Customers
FinTell. Improving Risk Management for Banking and Fintech with Graph and Machine Learning
Fintech Customers
Intuit. Leveraging Knowledge Graphs to Accelerate Intuit’s AI Journey

Fintech Customers
Global Bank Saves $50M By Transforming Fraud Detection with Real-Time Graph Analytics