Tier 1 Financial Institution Powers Real-Time Fraud Detection Across 50M+ Daily Transactions with TigerGraph

The Challenge
A Tier 1 bank needed to trace multi-hop fund movement and detect coordinated mule networks in real time. Building these capabilities from scratch would require a significant, multi-quarter engineering investment with considerable uncertainty.
The Solution
Implemented TigerGraph for low- latency multi-hop analysis of identity, device, transaction, and known-fraud relationships, executing ~15,000 graph queries per second with approximately 30ms allocated for graph-based fraud signals.
The Results
Created an always-on fraud detection platform capable of 3–5-hop analysis under strict real-time constraints, while continuously updating data and supporting analytics that help identify emerging fraud patterns and improve detection models.
The Challenge
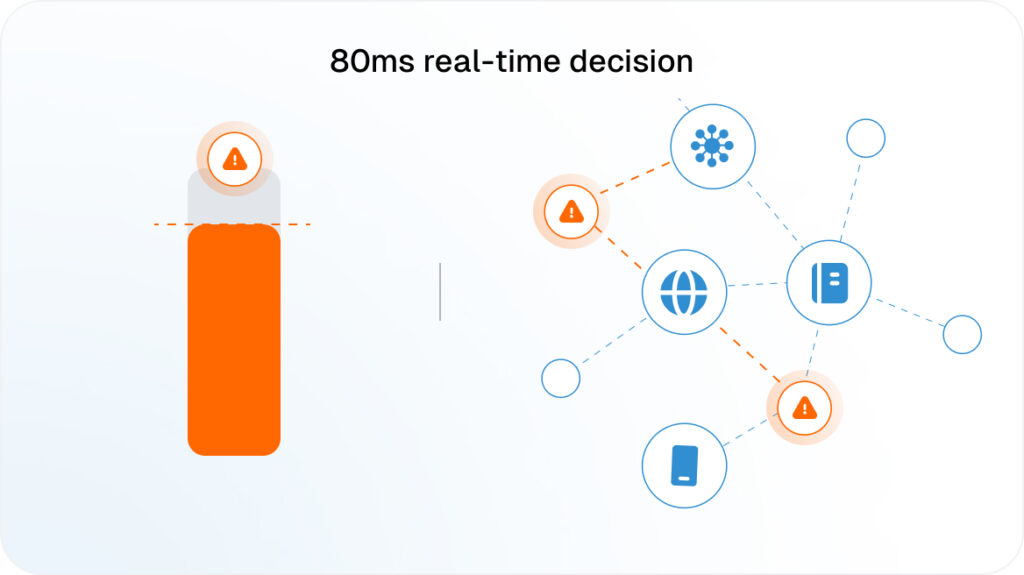
The institution needed to detect fraud signals that extend beyond individual transactions. Relevant signals include shared identity attributes across accounts, device reuse across transactions, proximity to known fraud entities, and connections to previously identified fraud rings. Detecting these indirect relationships requires multi-hop analysis across a graph dataset of approximately 10TB while transactions are being evaluated in real time.
The performance requirements were stringent. The complete fraud decision had approximately 100 milliseconds, with only about 30 milliseconds allocated to TigerGraph to perform multi-hop queries and evaluate graph-based signals. Each transaction required approximately five graph queries traversing three to five hops, producing an overall graph workload of approximately 15,000 queries per second.
The platform also needed to remain continuously available while receiving delta updates. Local and remote replicas were required for resiliency, while historical data needed to be preserved to support detection of long-running fraud networks.
The performance requirements were stringent. The complete fraud decision had approximately 100 milliseconds, with only about 30 milliseconds allocated to TigerGraph to perform multi-hop queries and evaluate graph-based signals. Each transaction required approximately five graph queries traversing three to five hops, producing an overall graph workload of approximately 15,000 queries per second.
The platform also needed to remain continuously available while receiving delta updates. Local and remote replicas were required for resiliency, while historical data needed to be preserved to support detection of long-running fraud networks.
The Solution
The institution implemented TigerGraph as part of its real-time transaction
fraud detection architecture. The graph represents relationships among
account identifiers, phone numbers, email addresses, Social Security
numbers, device identifiers, geographic attributes, and known fraud entities.
Edges capture shared attributes and transactional relationships, allowing
TigerGraph’s multi-hop traversals to identify indirect fraud signals that
would require expensive joins in relational systems.
The system is deployed across two geographically separated data
centers, East and West, with eight machines per data center and 16
machines overall. TigerGraph instances are replicated to increase query
throughput and support high-volume transaction scoring. This replication
architecture horizontally scales serving capacity to meet the approximately
15,000-query-per-second workload while supporting high availability and
regional resiliency.
The same graph also supports analytical workloads on a database replica
without affecting resources allocated to real-time fraud detection. Fraud
analysts and data scientists use ad hoc graph exploration, graph algorithms,
and graph embeddings for fraud-pattern detection, feature extraction, and
downstream machine learning models.
fraud detection architecture. The graph represents relationships among
account identifiers, phone numbers, email addresses, Social Security
numbers, device identifiers, geographic attributes, and known fraud entities.
Edges capture shared attributes and transactional relationships, allowing
TigerGraph’s multi-hop traversals to identify indirect fraud signals that
would require expensive joins in relational systems.
The system is deployed across two geographically separated data
centers, East and West, with eight machines per data center and 16
machines overall. TigerGraph instances are replicated to increase query
throughput and support high-volume transaction scoring. This replication
architecture horizontally scales serving capacity to meet the approximately
15,000-query-per-second workload while supporting high availability and
regional resiliency.
The same graph also supports analytical workloads on a database replica
without affecting resources allocated to real-time fraud detection. Fraud
analysts and data scientists use ad hoc graph exploration, graph algorithms,
and graph embeddings for fraud-pattern detection, feature extraction, and
downstream machine learning models.
The Results
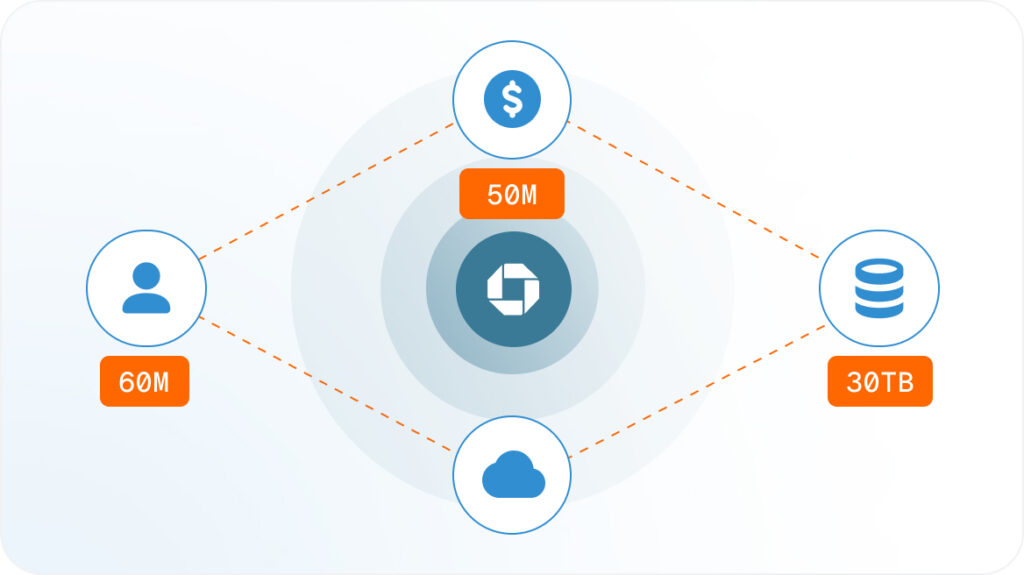
The institution created a fraud detection platform capable of analyzing large transaction graphs under strict real-time constraints. TigerGraph supports approximately 15,000 graph queries per second across a graph dataset of approximately 10TB, while the institution processes more than 50 million transactions daily. Each transaction can invoke approximately five queries traversing three to five hops, with approximately 30 milliseconds allocated to TigerGraph within the overall 100-millisecond fraud decision window.
The graph remains active while receiving continuous delta updates, with historical data preserved to support detection of long-running fraud networks. Replication across TigerGraph nodes scales query throughput without increasing query latency, while local and remote replicas provide resiliency for the always-on system.
By separating real-time transaction scoring from analytical workloads, the institution can also use graph exploration, algorithms, and embeddings to identify emerging fraud patterns and improve detection models while the production scoring pipeline continues operating.
The graph remains active while receiving continuous delta updates, with historical data preserved to support detection of long-running fraud networks. Replication across TigerGraph nodes scales query throughput without increasing query latency, while local and remote replicas provide resiliency for the always-on system.
By separating real-time transaction scoring from analytical workloads, the institution can also use graph exploration, algorithms, and embeddings to identify emerging fraud patterns and improve detection models while the production scoring pipeline continues operating.
More stories
Fintech Customers
FinTell. Improving Risk Management for Banking and Fintech with Graph and Machine Learning
Fintech Customers
Intuit. Leveraging Knowledge Graphs to Accelerate Intuit’s AI Journey

Fintech Customers
Global Bank Saves $50M By Transforming Fraud Detection with Real-Time Graph Analytics